
How to Read Candlestick Patterns: A Trader’s Guide

TL;DR:
- Reading candlestick patterns requires understanding their anatomy, color, volume, and context at key levels. Confirmation of the pattern through the next candle and volume exceeding 1.5 times the average increases its reliability. Applying a disciplined checklist approach helps traders avoid false signals and trade successfully across various markets.
How to read candlestick patterns is the process of interpreting price action visually on a chart using four data points: open, high, low, and close prices. Each candle compresses an entire trading period into a single visual unit, letting you see market sentiment at a glance. Mastering candlestick pattern analysis is one of the most transferable skills in trading, applying equally to forex, stocks, crypto, and commodities. Ollatrade’s charting tools make this analysis accessible whether you are reading your first chart or refining an advanced strategy.
How to read candlestick patterns: anatomy of a single candle
A standard candlestick represents four price points for a given time interval: the open, high, low, and close. The rectangular body shows the distance between the open and close. The thin lines extending above and below the body are called wicks or shadows, and they mark the session’s highest and lowest prices.
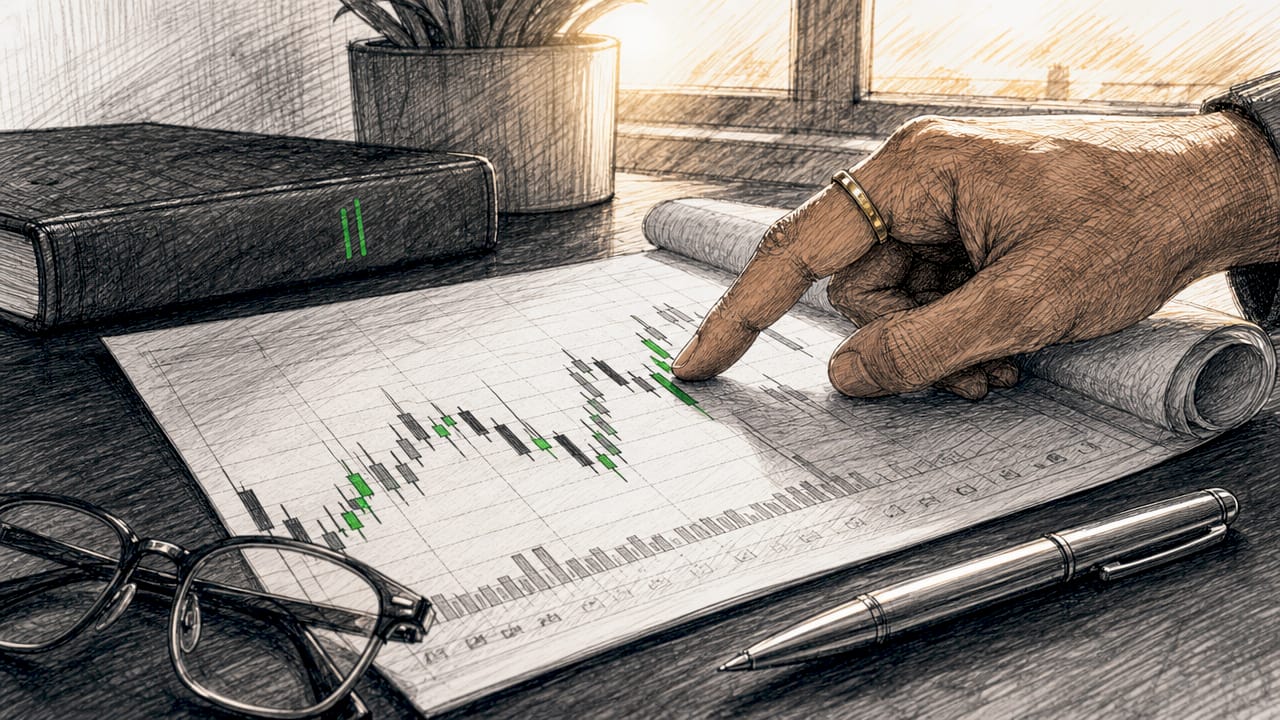
Color tells you direction instantly. A green or hollow body means the close was higher than the open, signaling a bullish period. A red or filled body means the close was lower than the open, signaling a bearish period. That single color distinction is the foundation of reading candlestick charts.
Body size and wick length carry meaning beyond direction. Large bodies indicate conviction: buyers or sellers dominated the session with little resistance. Small bodies signal hesitation. Long wicks show that price moved aggressively in one direction but was rejected before the close, which is a sign of supply or demand at that level.
- Long upper wick, small body: Buyers pushed price up but sellers took control before the close. Bearish pressure at that level.
- Long lower wick, small body: Sellers drove price down but buyers stepped in strongly. Bullish pressure at that level.
- Large body, short wicks: One side dominated the entire session. Strong directional conviction.
- Small body, long wicks on both sides: Neither side won. Classic indecision candle.
Pro Tip: When you spot a candle with a wick more than twice the length of its body, that rejection is worth noting on your chart. It often marks a short-term turning point, especially near known support or resistance.
Which candlestick patterns signal reversals and continuations?
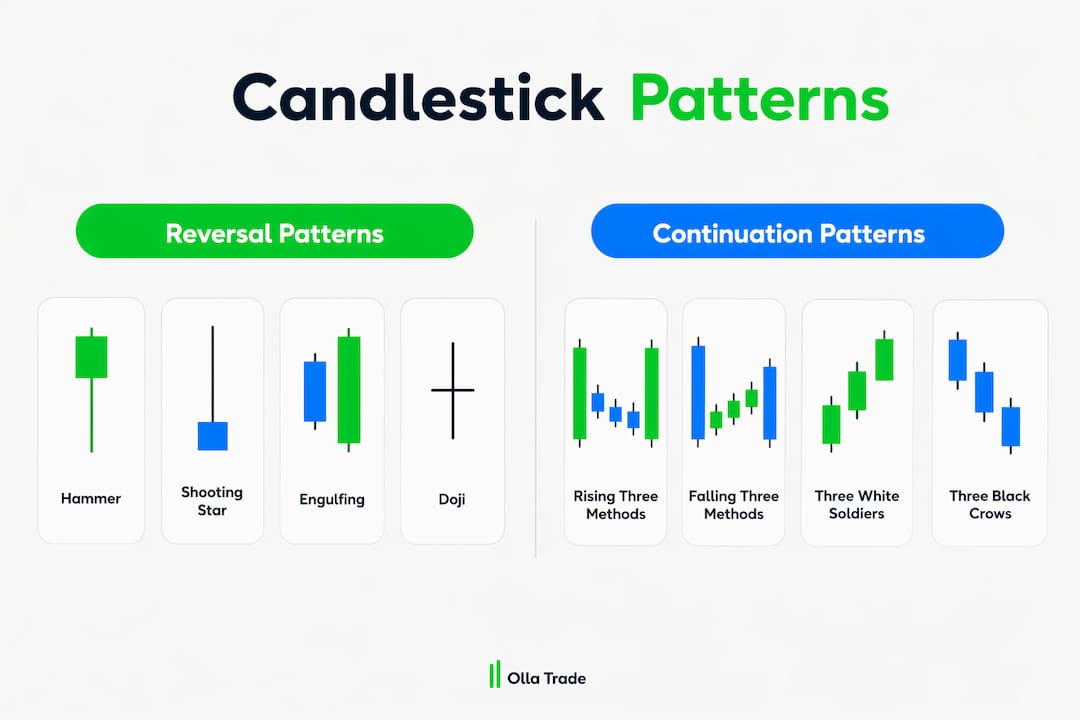
Pattern recognition is where understanding candlestick patterns moves from theory to practical use. The most reliable formations fall into two categories: reversal patterns and continuation patterns.
Reversal patterns include the Hammer, Shooting Star, Engulfing, and Doji. Each signals a potential shift in who controls price. Continuation patterns, like the Rising Three Methods and Falling Three Methods, suggest the existing trend is pausing briefly before resuming.
The table below summarizes the most common candlestick formations traders use daily.
| Pattern | Type | What it signals |
|---|---|---|
| Hammer | Reversal (bullish) | Long lower wick after a downtrend; buyers rejecting lower prices |
| Shooting Star | Reversal (bearish) | Long upper wick after an uptrend; sellers rejecting higher prices |
| Bullish Engulfing | Reversal (bullish) | Large green candle fully covers prior red candle; buyers take control |
| Bearish Engulfing | Reversal (bearish) | Large red candle fully covers prior green candle; sellers take control |
| Doji | Indecision/Reversal | Open and close nearly identical; neither side won the session |
| Rising Three Methods | Continuation (bullish) | Small bearish candles within an uptrend, followed by a strong bullish close |
| Falling Three Methods | Continuation (bearish) | Small bullish candles within a downtrend, followed by a strong bearish close |
The Bullish and Bearish Engulfing patterns are among the most reliable single-signal formations available. The engulfing candle physically consumes the prior candle’s body, showing a decisive shift in momentum. A Doji’s open and close are nearly identical, which tells you the market is at a decision point. A Doji alone is not a trade signal. It becomes meaningful when the candle that follows it confirms a direction.
Continuation patterns require a different mindset. The Rising Three Methods shows three small red candles inside a bullish trend, followed by a strong green candle that closes above the prior high. The pattern tells you sellers tried to push back but failed. The trend resumes with renewed force.
How to analyze candlestick patterns in context
Isolated pattern recognition is the most common mistake traders make. Context is the most important principle in candlestick analysis. A Hammer at the bottom of a clear downtrend near a major support level is a high-quality signal. The same Hammer appearing in the middle of a sideways range carries far less weight.
Three factors define whether a pattern is worth trading:
- Location: Is the pattern forming at a structural level? Support, resistance, a key moving average, or VWAP all qualify. Patterns at random price levels have low predictive value.
- Confirmation: Does the next candle follow through in the expected direction? A bullish reversal pattern needs a green candle after it. Without that confirmation, the signal is unverified.
- Volume: Volume exceeding 1.5x the recent average at the time of the pattern significantly increases its reliability. High volume means more participants agreed with the move.
Candlestick patterns display the ongoing tug-of-war between buyers and sellers. A pattern only becomes meaningful when it shows a clear shift in who is winning that battle. Isolated patterns without confirmation are insufficient predictors on their own. Volume and trend confirmation are what separate a tradeable signal from noise.
Pro Tip: Add VWAP to your chart as a default. When a reversal pattern forms exactly at VWAP after a pullback in a trending market, the probability of follow-through increases substantially. It is one of the cleanest setups available on intraday charts.
Monitoring trading volume alongside your candlestick reads is not optional for serious traders. It is the filter that keeps you out of false signals.
What are the steps to apply candlestick analysis in your trading?
A repeatable process is what separates traders who use candlestick patterns profitably from those who see patterns everywhere and trade none of them well. Memorizing a few key patterns covers roughly 80% of practical trading situations. The rest is execution discipline.
-
Choose your timeframe and chart type. Higher timeframes (daily, 4-hour) produce more reliable patterns because more traders are watching the same levels. Beginners should start on the daily chart before moving to intraday analysis.
-
Identify significant price levels first. Mark your support and resistance zones, key moving averages, and VWAP before you look for patterns. You are not hunting for patterns randomly. You are waiting for patterns to appear at levels that already matter.
-
Spot the pattern and name it. When a formation appears at a key level, identify it specifically. Is it a Hammer? An Engulfing? A Doji? Naming it forces you to be precise about what you are seeing rather than seeing what you want to see.
-
Wait for the confirmation candle. This step eliminates the majority of false signals. Professional traders use a checklist: pattern at a structural level, next candle confirming direction, and volume at least 1.5x the recent average. All three conditions should be met before entering.
-
Plan your trade before you enter. Define your entry price, stop-loss level, and profit target based on the pattern’s logic. A Hammer’s stop goes below the wick’s low. A Bearish Engulfing’s stop goes above the engulfing candle’s high. The pattern itself tells you where you are wrong.
-
Review and log every trade. Pattern analysis improves with deliberate review. Log which patterns worked, at what levels, and under what volume conditions. Over time, you will find the specific setups that fit your markets and style.
This process applies across forex, stocks, and crypto. The patterns are universal. The key difference across markets is liquidity and session timing, not the patterns themselves. Reviewing chart patterns and their success rates across different markets will sharpen your ability to filter high-quality setups from weak ones.
Common pitfalls to avoid: trading patterns against the dominant trend, entering before the confirmation candle closes, and ignoring volume entirely. Each of these errors is documented in detail in Ollatrade’s guide on top trading mistakes to avoid.
Key Takeaways
Reading candlestick patterns reliably requires combining pattern recognition, structural context, confirmation candles, and volume above 1.5x the recent average before entering any trade.
| Point | Details |
|---|---|
| Candle anatomy is foundational | Body, wicks, and color together reveal direction, conviction, and rejection at price levels. |
| Context beats pattern alone | A Hammer only signals a bullish reversal at the end of a downtrend, not in random consolidation. |
| Confirmation is non-negotiable | Wait for the next candle to close in the expected direction before entering a position. |
| Volume validates the signal | Volume exceeding 1.5x the recent average confirms that a pattern reflects real market conviction. |
| A checklist approach works | Combining location, confirmation, and volume into a repeatable checklist filters out most false signals. |
What I have learned from years of watching candlestick patterns fail
Most traders who struggle with candlestick patterns are not failing because they do not know the patterns. They fail because they skip the confirmation step. I have watched traders take Hammer signals in the middle of choppy, sideways markets and wonder why the trade went nowhere. The pattern was real. The context was wrong.
The checklist approach changed how I trade. Before any entry, I ask three questions: Is this pattern at a level that already matters? Has the next candle confirmed the direction? Is volume elevated? If all three answers are yes, the trade is worth taking. If one answer is no, I wait. That discipline alone eliminates a large portion of losing trades.
Candlestick patterns are not magic. They are a visual summary of supply and demand at a specific moment. A Bearish Engulfing candle on the daily chart at a multi-month resistance level with above-average volume is telling you something real about who controls price. A Bearish Engulfing candle in the middle of a trend with thin volume is telling you almost nothing.
My recommendation: pick five patterns and learn them deeply across multiple markets and timeframes before adding more. The Hammer, Shooting Star, Bullish Engulfing, Bearish Engulfing, and Doji cover the vast majority of high-quality setups you will encounter. Depth beats breadth every time when it comes to pattern mastery.
— FX
Ollatrade’s tools for putting candlestick analysis into practice
Knowing the patterns is only half the work. Executing them on a live chart, across multiple markets, with real-time data is where the skill becomes profitable.

Ollatrade gives traders access to advanced charting through MetaTrader 4 integration, covering forex markets, CFDs on metals, indices, stocks, energies, and cryptocurrencies. Every instrument is available with the charting depth needed to apply candlestick pattern analysis properly. Traders at every level can access Ollatrade’s educational resources to build pattern recognition skills alongside live market practice. Tight spreads and fast execution mean that when your checklist is complete and your signal is confirmed, you can act on it without slippage eating your edge.
FAQ
What does a candlestick represent in trading?
A candlestick represents the open, high, low, and close prices for a specific time interval. The body shows the range between open and close, while the wicks show the session’s price extremes.
How do I know if a candlestick pattern is reliable?
A pattern is most reliable when it forms at a key price level, is confirmed by the next candle closing in the expected direction, and is accompanied by volume exceeding 1.5x the recent average.
What is the best candlestick pattern for beginners?
The Bullish and Bearish Engulfing patterns are the best starting point. They are visually clear, signal a decisive shift in momentum, and are among the most widely recognized reversal signals across all markets.
Does a Doji always signal a reversal?
A Doji signals indecision, not a guaranteed reversal. It becomes a tradeable signal only when the following candle confirms a directional move, ideally at a significant support or resistance level.
Can candlestick patterns be used in forex and crypto trading?
Candlestick patterns apply to any liquid market, including forex, crypto, stocks, and commodities. The patterns are universal because they reflect buyer and seller behavior, which occurs in every market.
Recommended
Articles are for informational and educational purposes only and do not constitute investment advice. Trading CFDs carries significant risk of loss. Past performance is not a reliable indicator of future results. Olla Trade Ltd. is an Anguilla registered entity.