
Morning Star Forex: The Bullish Reversal Pattern Explained
What is the morning star forex pattern?
The morning star is a three-candle bullish reversal pattern that signals a potential bottom in a downtrend. Forex traders use it to spot the moment sellers lose control and buyers begin stepping in. When the pattern forms correctly, it tells a precise story across three sessions: exhaustion, indecision, and recovery.
Here is what each candle represents:
- Candle 1 (Bearish): A long red or black candle that extends the existing downtrend, showing bears firmly in control.
- Candle 2 (The Star): A small-bodied candle, often a doji or spinning top, that gaps below the first candle’s close. It signals that selling pressure is stalling.
- Candle 3 (Bullish): A strong green or white candle that closes at least halfway up the body of the first candle, confirming buyers have taken over.
The pattern’s low point sits on the second candle, though that only becomes clear after the third candle closes. According to Bulkowski’s research, the morning star acts as a bullish reversal pattern 78% of the time across tested samples, ranking 12th in overall performance among 103 candlestick types. A key variation: when the middle candle is a doji specifically, it signals stronger indecision and often produces a more powerful reversal.
Why the morning star pattern matters in forex trading
The morning star pattern captures a genuine shift in market psychology, not just a visual formation. The first candle shows bears dominating. The second reflects a tug-of-war where neither side controls price. The third confirms bulls have won that battle.
Why traders value it:
- Sentiment shift is visible. The three-candle sequence maps the transition from bearish dominance to bull control in real time.
- Location amplifies reliability. Patterns forming near key daily support levels carry more weight than those appearing mid-range.
- Volume confirms conviction. When the third candle shows the highest volume of the three sessions, the reversal signal strengthens considerably.
- False signals are a real risk. Without trend context or volume confirmation, the pattern can appear in sideways markets and lead nowhere.
Pro Tip: Never evaluate the morning star in isolation. A pattern forming at a well-established support zone after a clear downtrend is a fundamentally different signal than the same three candles appearing in a choppy, directionless market.
The pattern’s opposite, the evening star, works identically in reverse: three candles marking the top of an uptrend, with a long bullish candle, a small indecisive star, and a strong bearish close.
How to trade the morning star pattern step by step
Identifying the pattern is only the first move. Execution requires confirmation, entry discipline, and a clear risk plan.
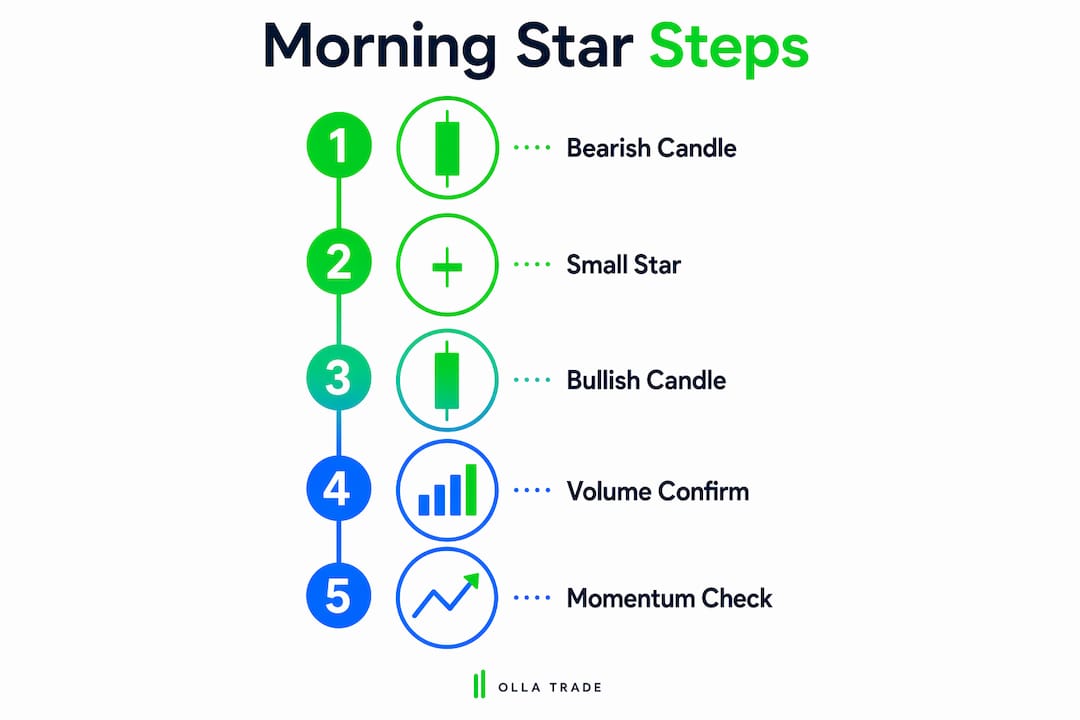
Step 1: Confirm the three-candle criteria. The first candle must be a long bearish body. The second must be small-bodied, gapping below the first. The third must close above the midpoint of the first candle’s body.

Step 2: Check volume. Volume should increase across all three sessions, with the third candle showing the highest volume. High volume on day three is often treated as confirmation regardless of other indicators.
Step 3: Add momentum confirmation. Look for RSI below 30 after the third candle closes, or a MACD crossover where the histogram turns positive. Either reading adds confidence that buyers are genuinely stepping in.
Step 4: Enter the trade. Most traders enter long at the open of the session following the third candle, or just above the third candle’s close. Waiting for a confirmed close avoids entering on a pattern that has not yet completed.
Step 5: Set your stop-loss. Place it below the low of the second (star) candle. That level represents the pattern’s structural floor; a close below it invalidates the setup.
- Combine the pattern with candlestick pattern reading skills to sharpen your identification accuracy.
- The 4-hour and daily timeframes filter out noise and produce more reliable signals than shorter intervals.
- Avoid trading the pattern on illiquid pairs where spreads distort the candle structure.
Pro Tip: If the third candle’s body barely clears the midpoint of the first candle, treat it as a weak signal. The deeper the third candle penetrates the first candle’s body, the stronger the reversal force.
A real example of the morning star on a forex chart
On April 12, 2025, the EUR/USD daily chart formed a textbook morning star sequence. The setup unfolded as follows:
| Candle | Direction | Key Detail |
|---|---|---|
| Candle 1 | Bearish | Long body, closed near session low |
| Candle 2 | Doji | Small body, lingered at prior close level |
| Candle 3 | Bullish | Opened below doji close, closed well above it |
Confirmation signals that accompanied the pattern:
- RSI dropped to 25 after the third candle, indicating an oversold condition.
- The MACD line crossed above its signal line and moved into positive territory.
- Price was resting near a visible support zone from prior sessions.
The trade entry was placed at 1.0950, with a stop-loss at 1.0905, below the bearish candle’s low. The profit target sat at the previous swing high of 1.1030. The trade closed at 1.1028, producing a gain. The daily timeframe gave the pattern enough room to develop cleanly, and the RSI plus MACD confluence removed ambiguity about the direction.

Advanced insights for trading the morning star with higher accuracy
The morning star’s frequency rank of 66 out of 103 candlestick types means you will not see it every week. That rarity is actually useful: when it does appear, it tends to carry weight. The challenge is making sure you are trading the right version of it.
Pattern stat: The morning star tests as a bullish reversal 78% of the time, ranking 12th out of 103 candlestick types for overall performance.
Context is everything. Morning stars that form during a downward retrace within a larger uptrend consistently outperform those appearing at the end of an extended downtrend. When price is already in a primary uptrend and pulls back to form the pattern, the third candle essentially rejoins a trend that already has momentum behind it.
Common mistakes traders make:
- Ignoring the star candle’s size. A large second candle is not a star. The indecision candle must be genuinely small relative to the first.
- Trading in sideways markets. Without a prior downtrend, the pattern has no reversal to signal.
- Skipping momentum indicator confirmation. RSI and MACD are not optional extras; they filter out the false positives that cost traders money.
Professional traders build confluence: a morning star at a key support zone, with oversold RSI, a MACD crossover, and rising volume on the third candle. Each layer reduces the probability of a false breakout. For deeper context on reading these setups within a broader technical analysis framework, the principles of trend alignment and indicator confluence apply across every pattern you trade.
Pro Tip: Patience is the edge. The morning star’s post-breakout trend tends to develop slowly before accelerating. Traders who exit after 10 days often underperform those who let the trend run its course.
Key Takeaways
The morning star is a three-candle bullish reversal pattern that works best when confirmed by volume, support levels, and momentum indicators like RSI or MACD.
| Point | Details |
|---|---|
| Pattern structure | Three candles: long bearish, small star, strong bullish closing above the first candle’s midpoint. |
| Reversal accuracy | Tests as a bullish reversal 78% of the time, ranking 12th in overall performance among 103 candlestick types. |
| Best context | Patterns forming during a downward retrace of a primary uptrend outperform those at the end of extended downtrends. |
| Risk management | Place stop-loss below the star candle’s low; enter long at or just above the third candle’s close. |
| Ollatrade | Ollatrade’s MetaTrader 4 integration and charting tools let you spot and act on morning star setups across major forex pairs. |
Put your morning star knowledge to work with Ollatrade
Reading the pattern is one thing. Having the right platform to act on it is another. Ollatrade gives forex traders direct access to major pairs like EUR/USD and GBP/JPY with tight spreads, fast execution, and full MetaTrader 4 integration, so the three-candle setups you identify on the daily or 4-hour chart translate into clean, low-slippage entries.
The platform includes built-in charting tools, RSI and MACD overlays, and volume data, exactly the confirmation stack this pattern requires. Whether you are trading your first morning star or refining a confluence-based approach, Ollatrade’s forex trading environment is built for the kind of disciplined, indicator-confirmed execution that separates profitable pattern trading from guesswork. Ready to apply what you have learned? Start with Ollatrade’s step-by-step forex guide and put a structured trading plan behind every setup you spot.
Recommended
Articles are for informational and educational purposes only and do not constitute investment advice. Trading CFDs carries significant risk of loss. Past performance is not a reliable indicator of future results. Olla Trade Ltd. is an Anguilla registered entity.